From custom charts to complex applications

Found applications in oil and gas industry, IoT, energy, finance, telecommunications, and many more industrial fields.

Open source

Our code is open source and available for all to use.

Custom development

CorpGlory creates a more efficient work environment by integrating Chartwerk into your existing system.

Complete solutions

We offer a complete suite of solutions for monitoring and visualizing your data. From analytics to visuals.

Grafana Plugin
Development and support applications for Grafana: custom datasources, plugins and visualizations.
Services & Skills
By working in the IT sector for many years we have learned to adapt quickly to changes and new ideas.
Our Proposal
We have success stories of applied solutions for the oil and gas industry, IoT, energy, finance, telecommunications, and many more industrial fields.
Example Projects

Complex applications

Get a complete dashboard with charts from Chartwerk and attach there everything your customer needs.

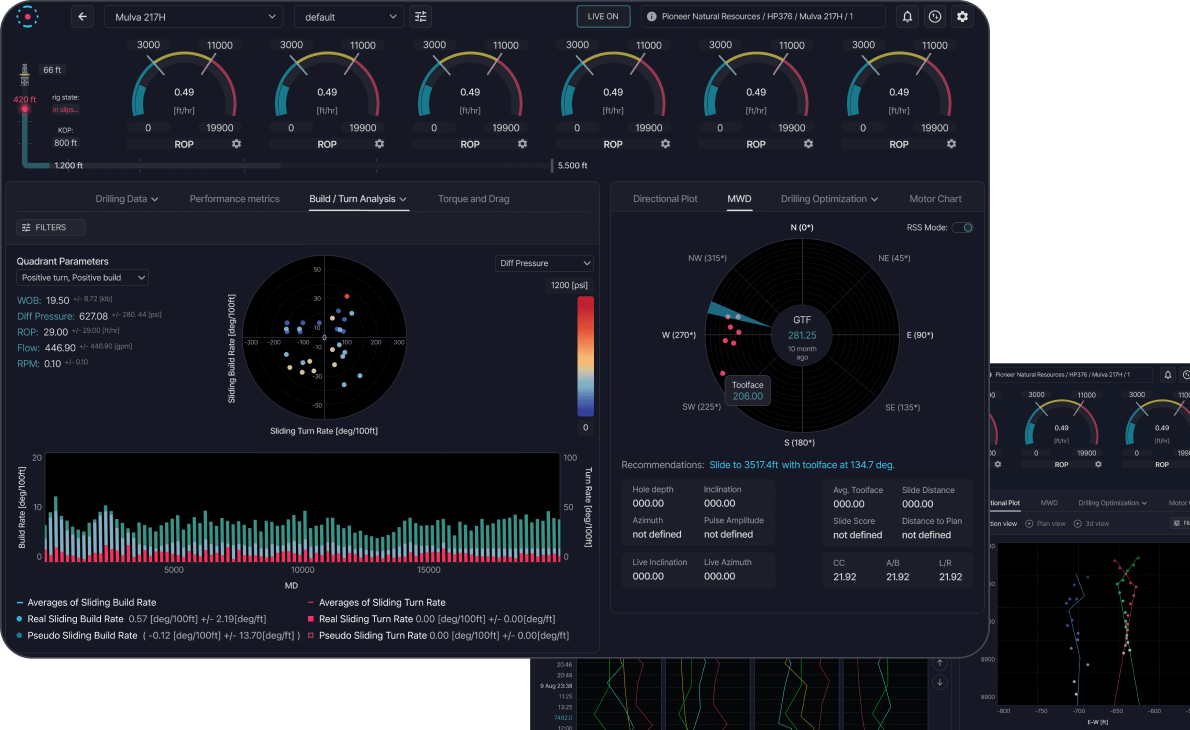
nvicta.ai

Nvicta provides data analytics and decision-automation tools to empower remote drilling operations. Interface based on Сhartwerk.
Real-time control, analytics and a separate application for processing data and calculation of rigs performance. Interface based on Сhartwerk.

Example project — Custom Charts

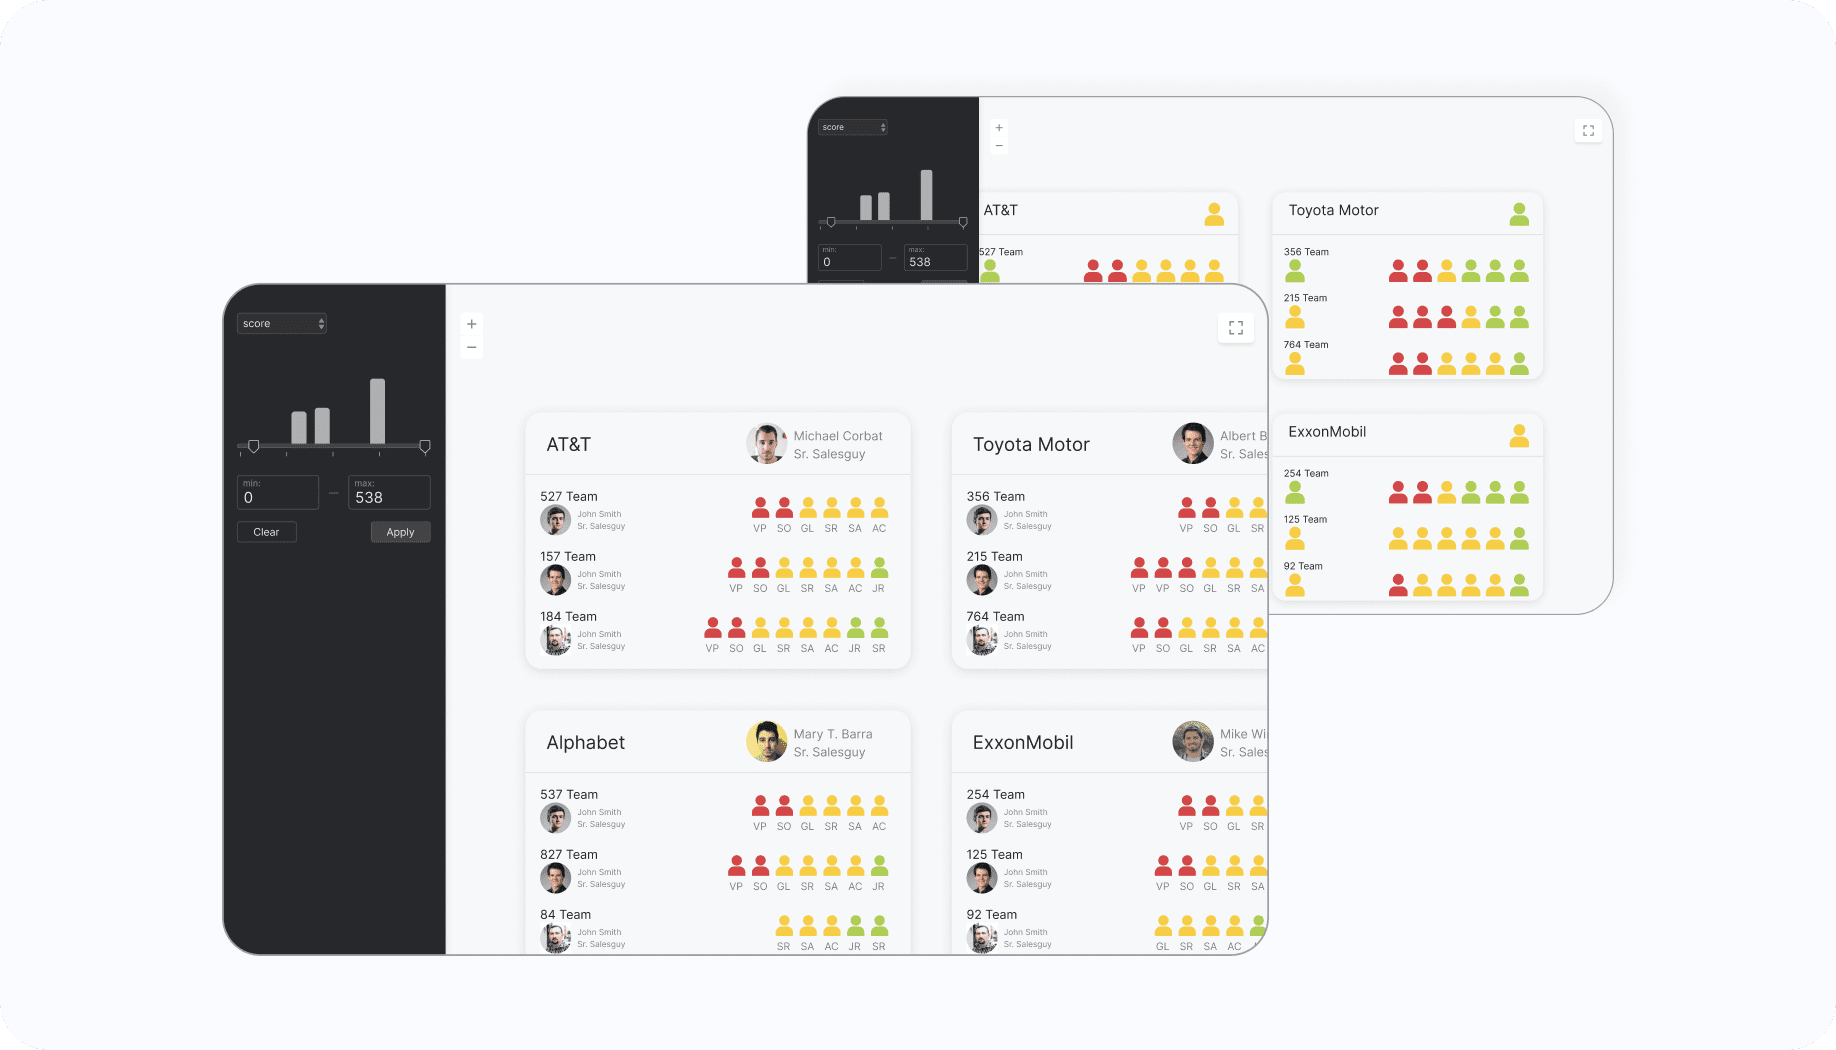
Chartwerk did an application with tree structure and dashboard features related information.
Managers were empowered with the ability to monitor their own efficiency through a tree-structured application.

Data Visualization Services & Consulting

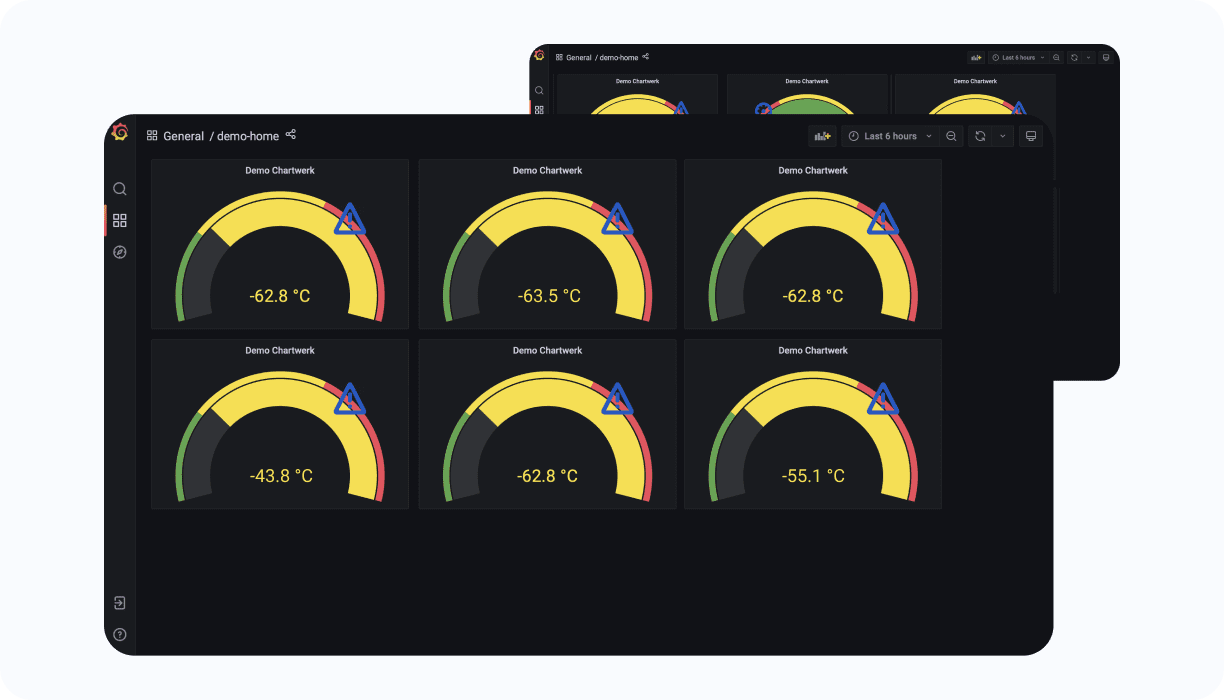
With the customer's request, we developed an alternative gauge for Grafana that shows changes in minus values.
Now available with our plugin - Chartwerk Panel!

Grafana Plugin

Development and support of applications for Grafana: custom datasources, plugins and visualizations.

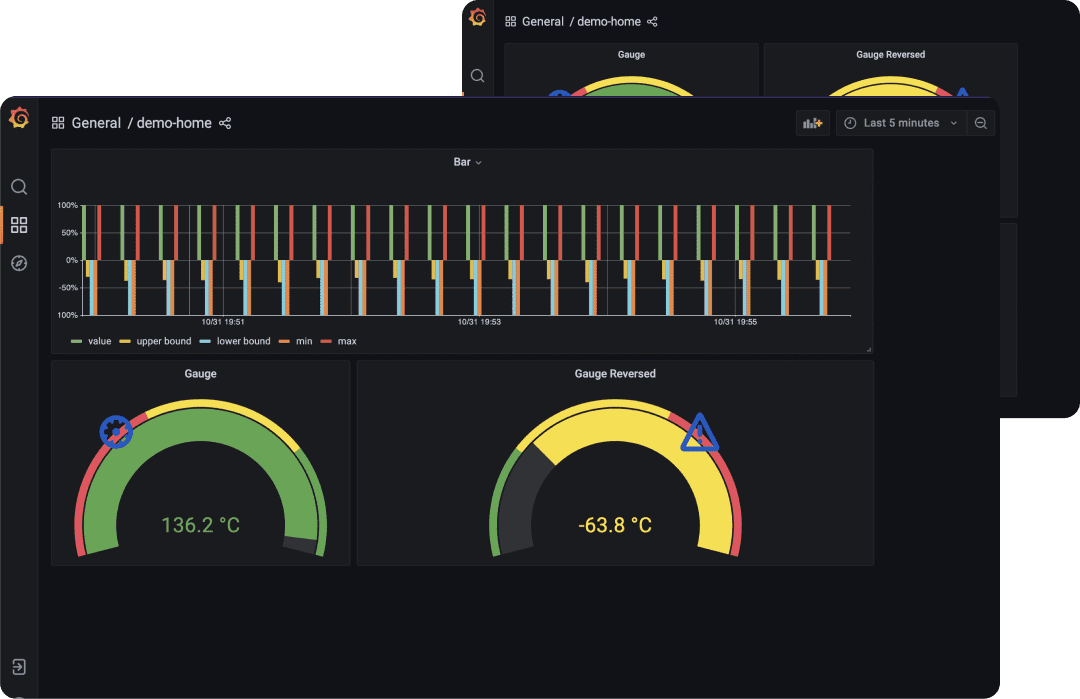
Chartwerk panel

Renders metrics using Chartwerk libraries. At the moment it's basically a better version of default Gauge panel.
You can ask as to make customization and we are working on new charts like Graph and Bars.
See our Plugin

Data Visualization Services We Offer

Dashboards

Dashboards and reports

Create tailored dashboards and reports for a diverse range of users:
Operational dashboards for managers to monitor business processes
Analytics dashboards for data experts to identify trends, build forecasts
Visualization

Visualization optimization

Upgrade your data visualization solution by optimizing it at different architectural layers:
Visualizations (dashboards, reports, paginated reports, etc.)
Data sources
Data model
Development

Custom charts development

Allow you to visualize the collected analytics data in your analytics data store:
Developing plugins for Grafana
Сharts from our library (Line chart, Bar chart, Scatter plot, Gauge, Radial)
Development special charts and functions on request